


Issue:
Customer relationship management, clustering (customer segmentation)
RFM analysis for successful customer segmentation – Part II
the writer :
Mr. Engineer Behnam Behzadi Far / Respected manager of relationship with customers of Mustafavi Saffron brand

RFM data visualization
Graphical representation of RFM helps you and other decision makers in your organization better understand your organization’s RFM analysis. R, F and M have values between 1 and 5, in total = 1255*5*5 is calculated from the combination of RFM components. The three components R, F, and M as three dimensions can best be plotted on a 3D (three-dimensional) diagram. If we want to see how many customers we have for each RFM value, we need to examine 125 data points. But working with 3D diagrams on paper or computer screen will not be so effective. We need something in two dimensions, something that is easier to visualize and understand.
Simple presentation of RFM analysis
In this method, we plot F + M on the Y axis (range 0 to 5) and R (range 0 to 5) on the X axis. This reduces the possible combinations from 125 to 50. It makes sense to combine F and M into one component because they both relate to how much a customer buys. R on the other axis gives us a quick look at the level of customer re-engagement.
For example, consider a business that is based on creating subscriptions for customers. For a customer with a monthly subscription of 100 thousand tomans, his M will be 1.2 million tomans for the whole year, but his F is 12 because of the monthly bill. On the other hand, consider a business that does not have a monthly model or offers a subscription for 1.2 million tomans annually, this business shows a good M but an F due to a once-a-year purchase. It is only 1. Customer is equally important in both cases and our approach of combining F and M scores gives them equal importance in RFM analysis.
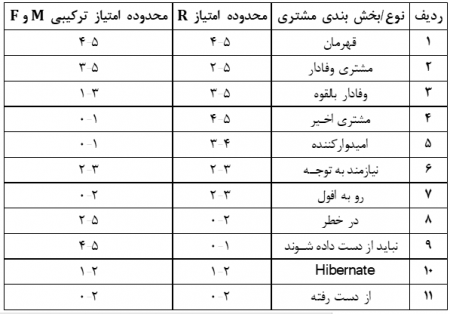
Understanding the 50 sections and examples of RFM may still be tedious. So we condensed the analysis into 11 sections to better understand our customers. If you remember, we discussed about these sections at the beginning of this note in the first part.
Pay attention to the table below. This table suggests how you can create 11 different customer segments based on RFM scores.
Provide final RFM analysis
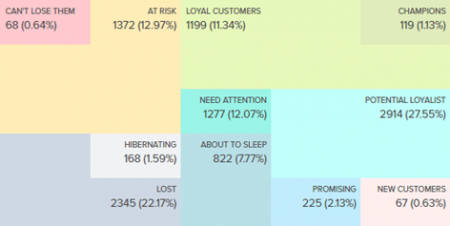
Assigning distinct colors to each section allows for easier recall of each section. If we choose the colors sensibly and according to a certain protocol, the visual presentation of our reports will be in a very desirable way that can be shared with others and will also be much more understandable.
You can see the final summary report of the RFM analysis in the figure below.
RFM analysis software solutions
With the increased focus on customer relationship management (CRM), RFM has become an integral part of marketing and business analytics. If you are evaluating your customers’ buying behavior one-time, you can easily get by with manual or semi-automated RFM analysis. But if you have a large database, you don’t have to do all the complex calculations yourself.
- RFM calculations using Excel
Bruce Hardy and Peter Fader wrote a detailed note on using Excel to calculate RFM scores. They also have a sample Excel file you can use. But this note is from 2008 and may need updating. You can download the Excel file suggested by them by clicking on the link below.
http://www.brucehardie.com/notes/022/creating_CDNOW_RFM_summary.zip
There is another Excel template provided by UMass Business Solutions, and to use it, you have to spend about $8, which may not be an easy solution for us Iranians. But I will post its link below so you can visit there.
http://www.umacs-business-solutions.com/customer-lifetime-value.html
Another solution for setting up RFM calculations using Excel is provided on the Cog iView site, which won’t hurt to visit.
http://www.cogniview.com/blog/how-to-use-excel-to-identify-your-best-customers/
- Some CRM tools
There are many CRM software that can automatically calculate the RFM score and segment your customers. If your tool has RFM support and you are not using it, or even if you are not sure that it provides such a service, be sure to contact your CRM.
- RFM analysis using Python/R programs and other analysis tools
R and Python programs are very popular for statistical and business analysis. If you have a “Data Science” team in your organization, first of all, good luck with your mature organization! And secondly, the best thing is to write a custom RFM model for your business using existing tools and programs.
- RFM for store software such as Shopify, BigCommerce and TicTail
Retention Grid is a dedicated software service in the field of RFM analysis. This solution can import data from Shopify, BigCommerce or Tic Tail applications into your store and display various reports with excellent graphical view of different parts of RFM.
-
RFM analysis for online stores
Putler software provides comprehensive RFM analysis, and many other business analysis and reporting tools and solutions. The app is built for e-commerce and supports automatic synchronization with major payment gateways and e-commerce systems. In other words, it enables the integration process with other financial systems and software. Patler can also provide you with detailed reports on many other things like sales, products, visitors, etc.
RFM analysis in Putler is available in the client dashboard, we have provided a snippet of this software for you below:
Variety of RFM models
RFM is a simple framework for quantifying customer behavior. That is, it enables us to measure the qualitative component of behavior with the help of numerical items and to have a detailed analysis of it with the help of quantitative numbers. Many people have expanded and diversified the RFM segmentation model.
Two of the most prominent models are:
- RFD (Recency, Frequency, Duration) – Duration or time period, here is the time spent. This method is especially useful when analyzing consumer behavior for readers of magazines and newspapers and books, viewers, and surfing-related services and products.
- (Recency, Frequency, Engagement) RFE – Engagement can be a composite value based on time spent on web pages, number of web pages per visit, bounce rate, interaction on social networks, etc., especially useful for online businesses.
You can perform RFM for all of your customers or just a subset of them. For example, you might first segment customers by geographic region or other demographic information, then segment by RFM for behavioral segments and transaction records.
I advise you to start with a simple task, test and gain experience, and continue until you succeed.


)
No views